Week 2
Setting up RStudio
- If it’s not installed already, refer to Lab 1.
- You need to install R (the language) AND RStudio (the IDE - Integrated Development Environment)
- The is what you use to write R code, but when you “run” the code, it refers to R (technically “rlang”)
Settings in RStudio
- Important to not open up your last project
- Don’t save you .RData (variables)
- Be deliberate about your code!

Scope in RStudio
Three ways to run R code:
- When you run an entire file Rmd, it runs in it’s own environment. The whole Rmd must be self-sustainable. It has it’s own “Environment” (the Environment tab). This is needed to save your file as a PDF.
- When you run a chunk, it just sends it to the console. The console is also it’s own bubble.
- When you type something in the console, it cannot talk to the file Rmd.
How do you troubleshoot an Rmd?
- Clear your environment (the broom button on the Environment tab) and run each chunk (or line!) one-by-one by itself.
- Check each step! Does the output look like what you expect?
Why focus on reproducibility?
- There is a reproducibility “crisis” in science
- Social and natural, in any field where we want to show a relationship between two or multiple phenomenon
- It’s not just about “data” it’s about how what the data represents, how it is used, and whether or not we can make the same conclusions from that data
Data and methods matter
- Ontology: what is reality/true
- Epistemology: methods for figuring out reality/truth (or best approximation)
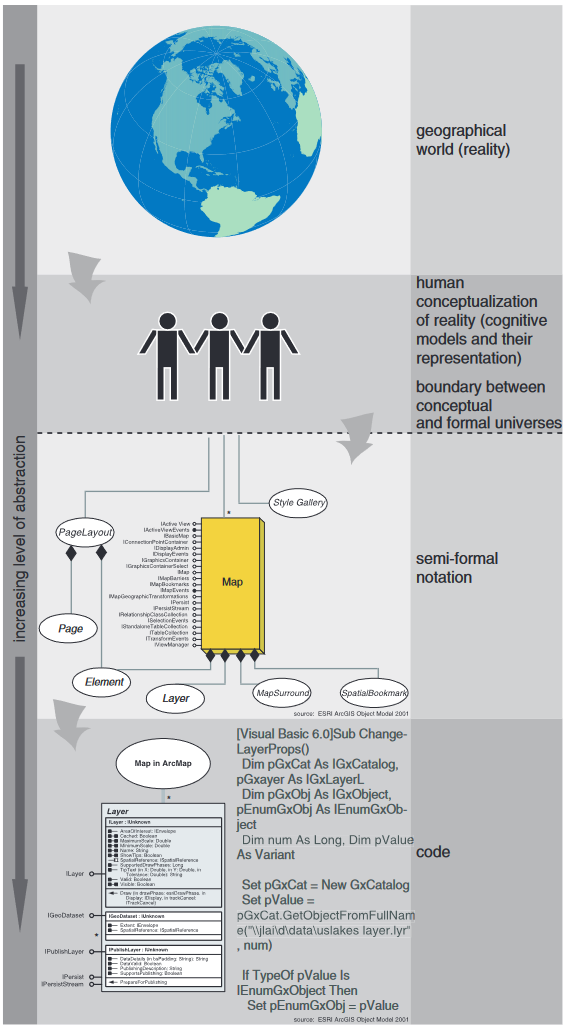
Data and methods matter
- How we represent reality (abstract) makes all data normative, there is no objective data
- Representation and abstraction often miss context of data collection, they capture a point in time
- What color is the slide background?
Slide background
On an RGB scale:
- HEX #191919
- RGB 25, 25, 25 or 10%, 10
- HSL 0, 0%, 10%
On other scales:
- CMYK 0.00, 0.00, 0.00, 0.90
- XYZ 0.9240, 0.9721, 1.0586
It’s basically black, how might the projector or the screen might impact this?
More Reading
- See Guide for Reproducible Research
- See Advantages and Limits in the Adoption of Reproducible Research and R-Tools for the Analysis of Omic Data
- See Good enough practices in scientific computing. Wilson, Greg, Jennifer Bryan, Karen Cranston, Justin Kitzes, Lex Nederbragt, and Tracy K. Teal. 2017. “Good Enough Practices in Scientific Computing.” PLOS Computational Biology 13 (6): e1005510.
- See Data Organization in Spreadsheets. Broman, Karl W., and Kara H. Woo. 2018. “Data Organization in Spreadsheets.” The American Statistician, April.
Why do we focus on this?
- You won’t necessarily be the owner of your work in the future.
- Your data will be taken out of context.
- Reproducibility improves the legibility of your work.
- Reproducibility improves the accuracy of your work.
File management
Each project (or lab, should have a folder). See Wilson et al on “Good enough practices in scientific computing”
Lab:
- .Rproj (which defines this current folder as the “base”)
- README.md (github: markdown file that describes your project, has your name)
- /bin (compiled outputs, result maps, can use “results”)
- /data (original source data)
- /doc (background or your own documents, like a data dictionary)
- /results (intermediary outputs, processed data)
- /src (scripts, like .Rmd or .r files)
Data management
Legends matter. Variable names matter. They should be different. See Broman and Woo in “Data Organization in Spreadsheets”
Be consistent with variable names. Pick one style and stick with it. Note where you put capital letters (computers are case sensitive), and where you put underscores and periods. Labels matter on maps.
- Max_temp_C ⇒ MaxTempC and a label of “Maximum Temp (C)”
- Mean.year_Growth ??