Lab 7 - Correlations
Lab 7
Background
Don’t skimp on these! There are some really useful links in here!
- For tips on plotting and doing the correlation, see this tutorial.
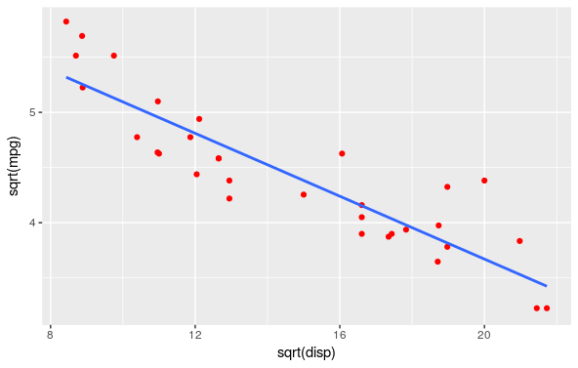
- Here is how to do a regression line in R, often called Ordinary Least Squares. We’ll continue to work on this through-out the rest of the course.
- Propublica on Slivers: One Trump Tax Cut Was Meant to Help the Poor. A Billionaire Ended Up Winning Big.
- My portfolio page, and the backend (with the
README.md) file that I use to keep my own resources.
Directions
GitHub Pages (not graded separately)
Add a project to your GitHub portfolio, follow instructions from in-class demo. Submit a link to your portfolio page here (not the backend).
Spatial Analysis (graded separately, please turn-in the PDF as well as zip file)
For a demonstration of collecting data for Lab 7, see this Lab 07 Demo.
Qmd Part 1: Follow the steps here (https://geodacenter.github.io/workbook/6a_local_auto/lab6a.html) to do your first lab in GeoDa. The sample data set can be downloaded here (https://geodacenter.github.io/data-and-lab/Guerry/). Reproduce this section in a Qmd.
Qmd Part 2: For any coastal/river-based place/county, use
tidycensusto download data on two different variables that you think are related, at the census tract level, and explore a relationship between the two variables using GeoDa. Useerase_waterto remove water from the shapefile. Save results into a shapefile and render this portion to html, then print to PDF.QGIS: Use your shapefile to produce a polished map showing the relationship. Include all the necessary components for a map.
Qmd Part 3: Explain what you did and your findings for Part 2. Include maps where necessary to show the geography and the erasure of water.
Grading
This I’ll be looking for while I’m grading.
(15 points) In your Quarto: What are the comments like, both in r chunks and in text? Are they sufficient? Is the formatting of the markdown proper? Are the headers done properly? Are r chunks named appropriately (hint: is there a setup r chunk)?
(10 points) Are the polished maps actually polished? Follow the guidelines discussed in class.
(5 points) Is your write-up clear? Does it explain the relationship?
Explore GeoDa, which has excellent documentation, and come come up do something that you’re proud of.
Turn-in
What to turn-in
Turn in a single PDF. - On the first page, please include a short header. - Complete the exercises and produce a polished map. - The output of your Qmd should be an HTML, which you then open and print to PDF.